How to use hashtags? The ultimate guide to boosting your Instagram SEO strategy
February 11, 20255 min read
How much are my posts on Instagram worth in euros? What is the potential of my profile? How is my advertising budget spent by Meta? And which format gives you the most visibility with your content? If you’ve ever asked yourself one of these questions, congratulations: you’ve opened the right article! The new Instagram “Reach […]
How much are my posts on Instagram worth in euros? What is the potential of my profile? How is my advertising budget spent by Meta? And which format gives you the most visibility with your content?
If you’ve ever asked yourself one of these questions, congratulations: you’ve opened the right article! The new Instagram “Reach Distribution” feature from Not Just Analytics helps you find the answers to these questions and others you may not have thought of yet.
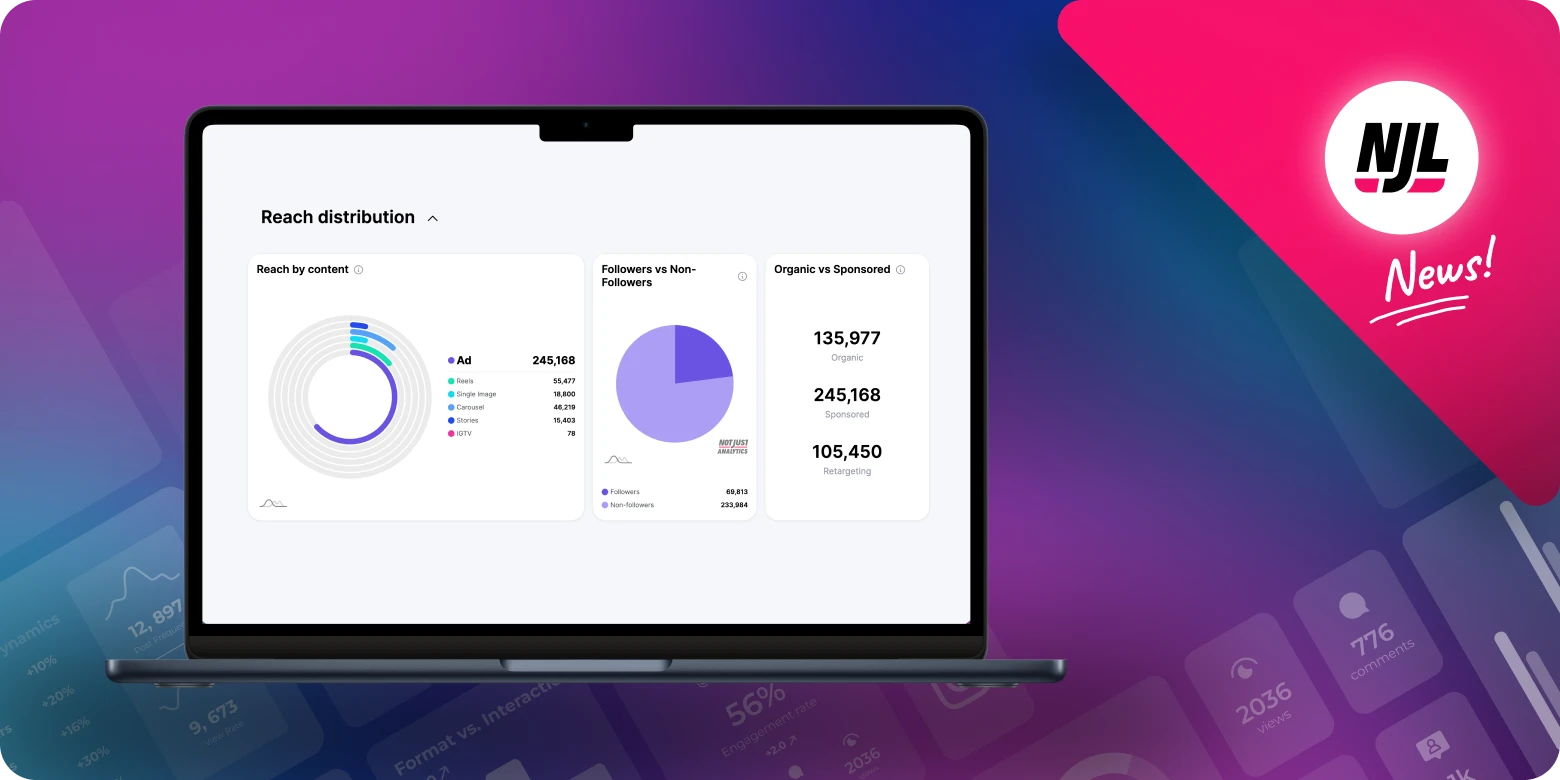
This new feature provides a clear and detailed picture of the distribution of your content’s reach. The most anticipated aspect is the analysis of reach from sponsored vs. organic posts, a highly requested feature by our users!
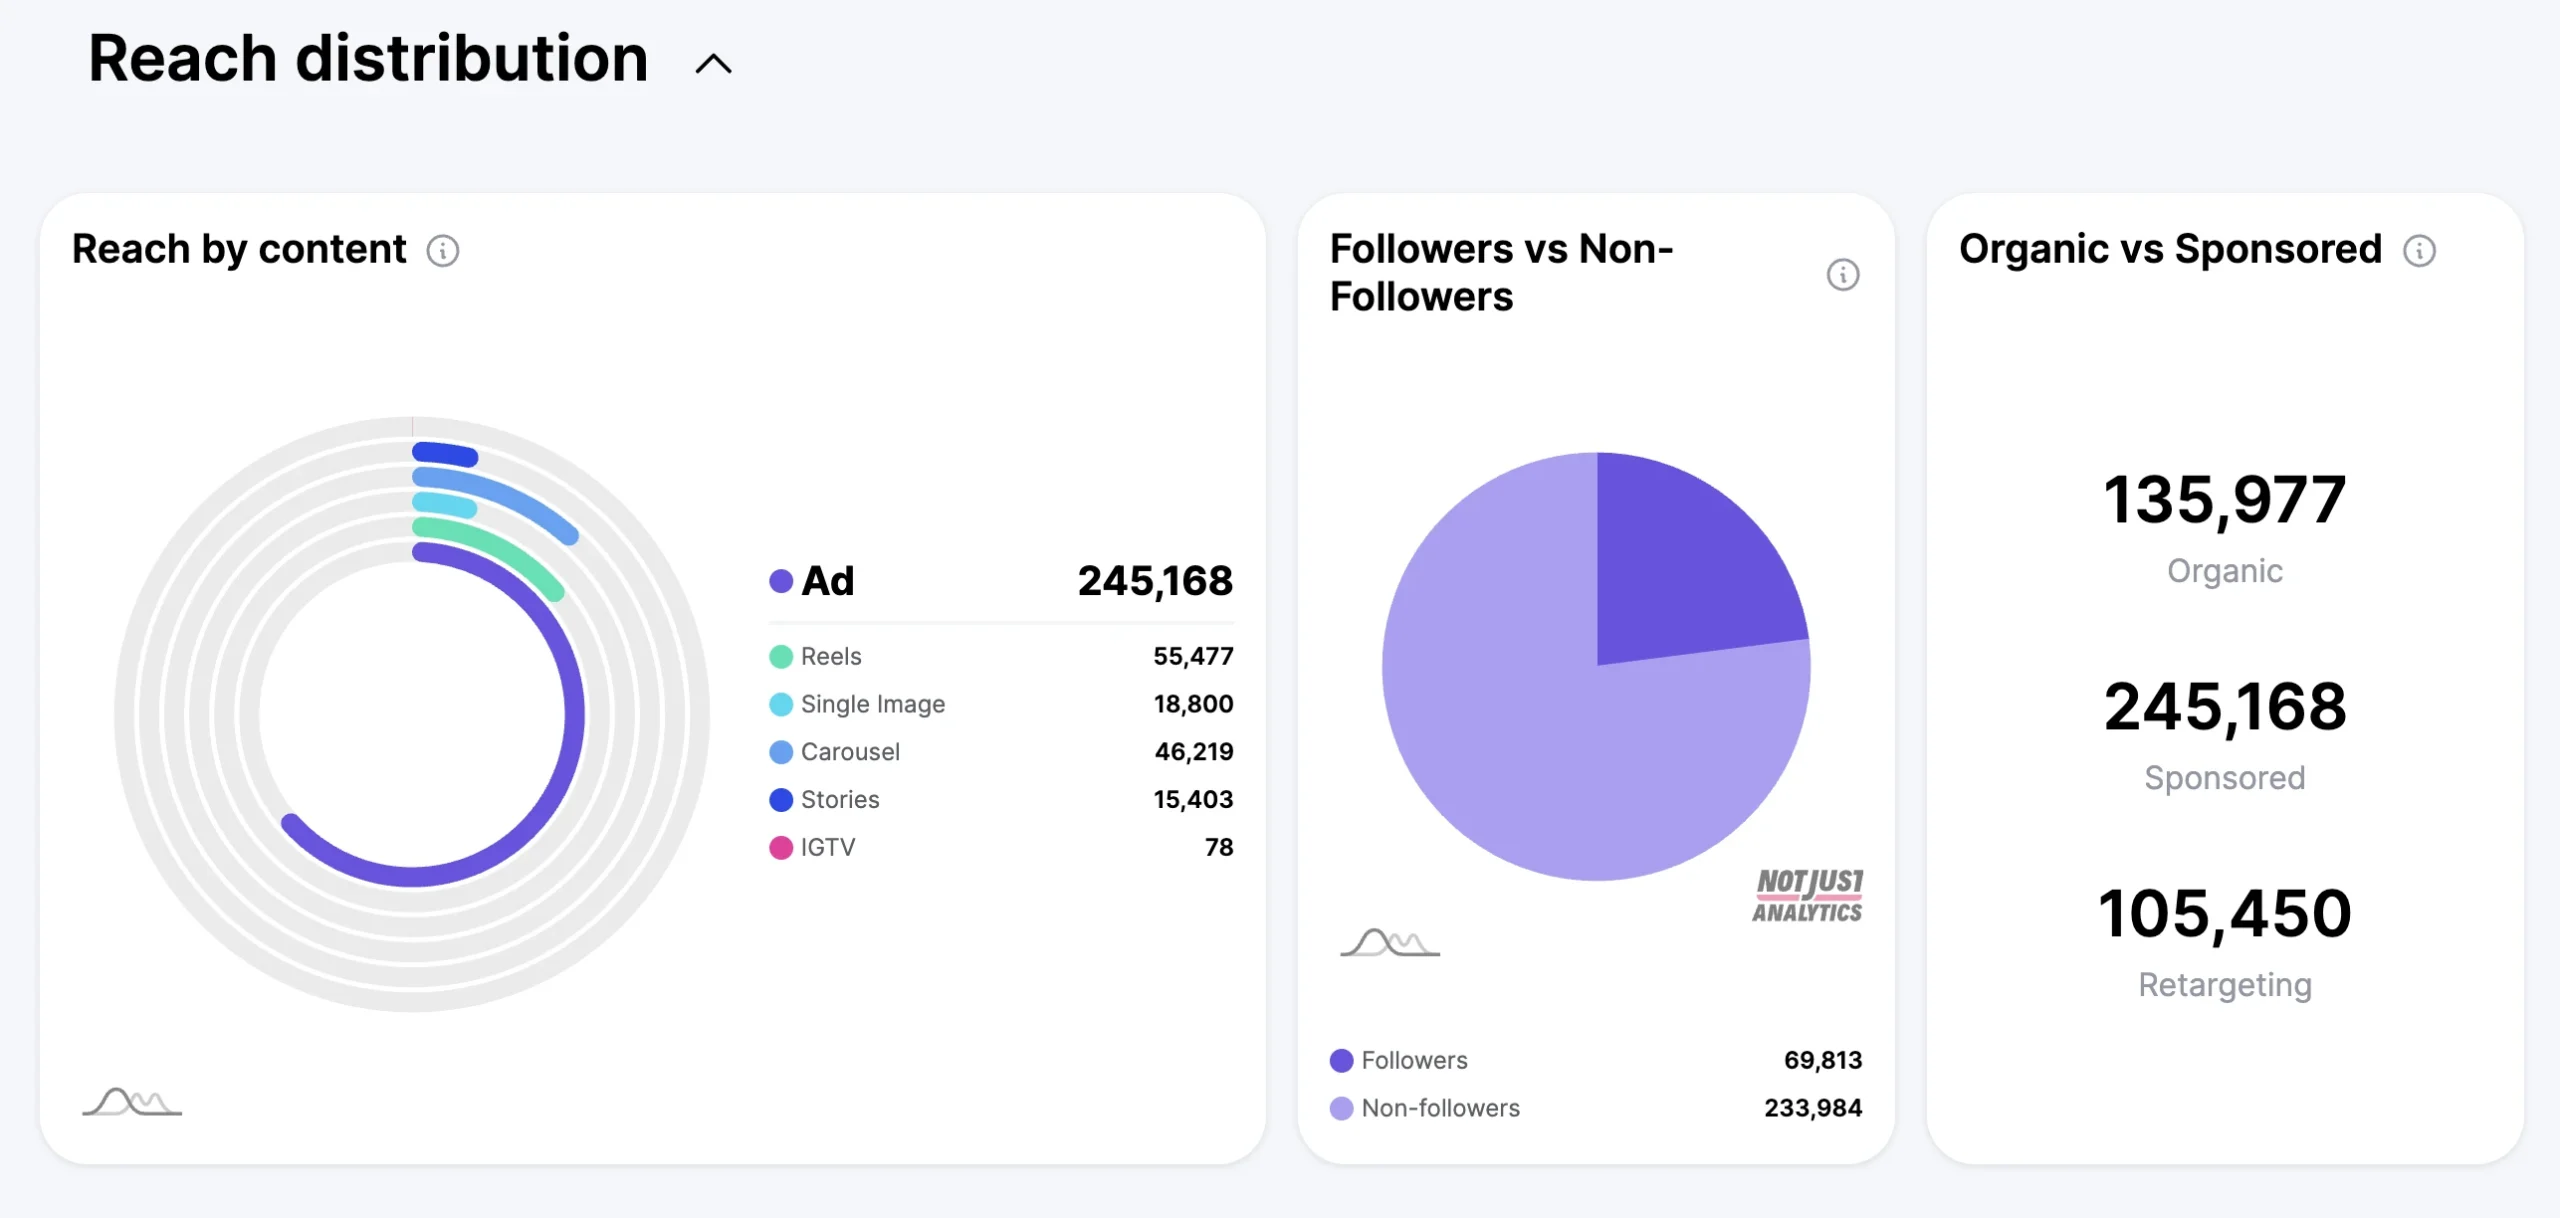
Here are all the new pieces of information you can find in your Instagram profile’s reach distribution: the breakdown of reach by various formats, the distribution between followers and non-followers you’ve reached, and finally, the total number of users reached through both sponsored and organic content. Of course, we didn’t stop there. The most interesting data shows the intersection between profiles reached by both sponsored and organic content! Keep reading to see a preview of “Nerd Mode”
To meet the diverse needs of our users, we’ve introduced two modes for viewing information on Not Just Analytics: Boomer and Nerd. No, it doesn’t depend on your age, but rather on your relationship with numbers. Boomer mode is designed for those who want clear, quick, and simple information and suggestions. In contrast, Nerd mode is for those who love drawing their own conclusions and want to develop their own analyses by examining the numbers. The data foundation is the same, but the presentation differs!
This type of visualization is available for all data analyzed with NJL. Let’s see specifically how these two modes apply to the reach analysis of your Instagram profile.
Boomer mode: simple & intuitive
A clear visual representation of your reach:
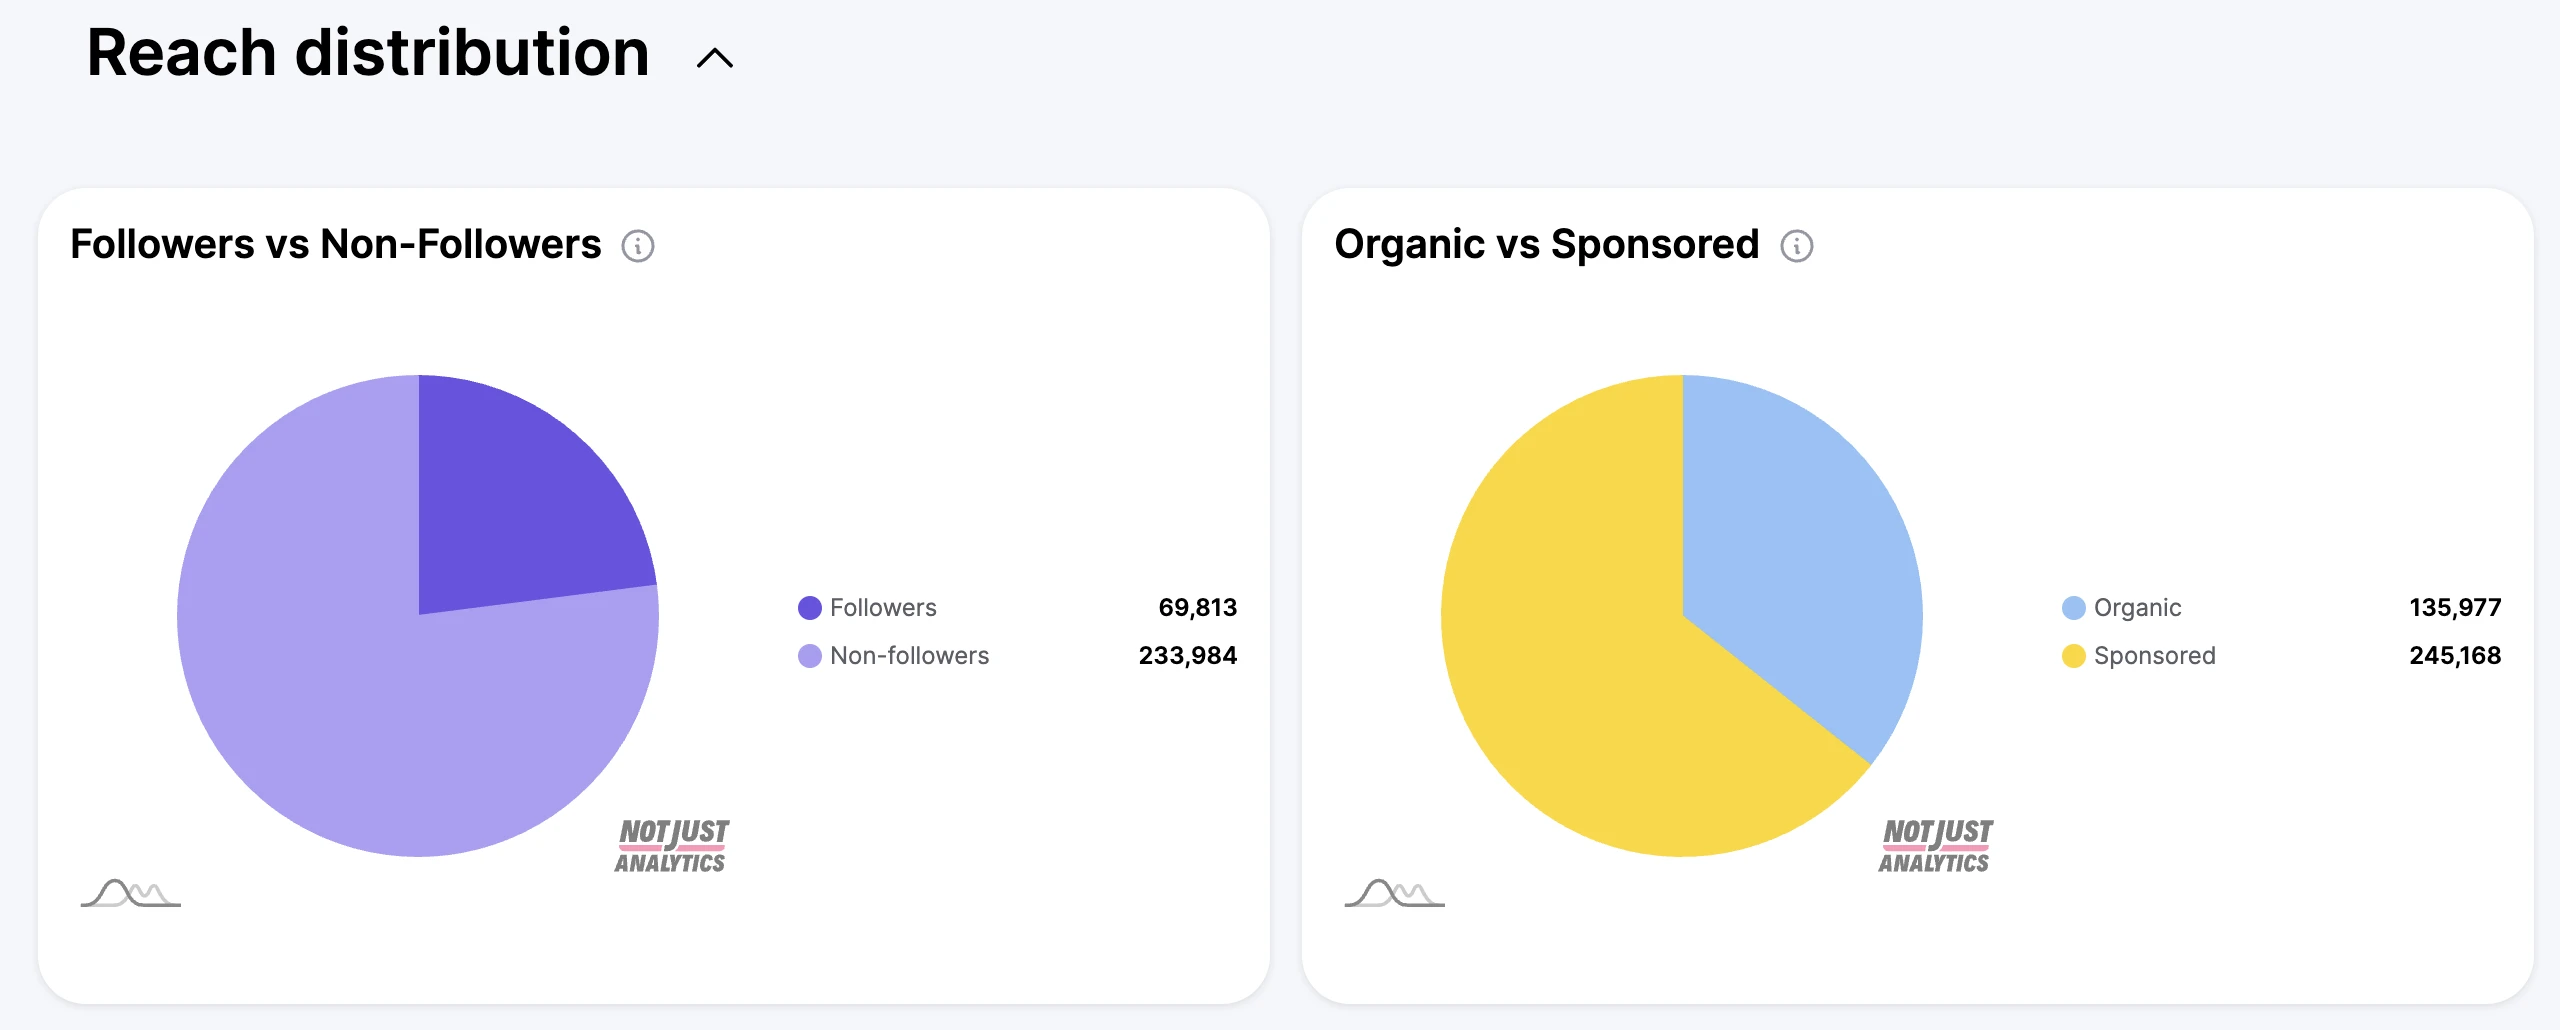
✅ Analyze the breakdown of coverage between followers and non-followers.
✅ Compare organic reach with sponsored reach.
This mode is perfect for obtaining quick insights or for those who aren’t data experts.You can see an example in the previous image. Thirsty for knowledge? Switch to Nerd mode!
Nerd mode: Detailed and In-Depth
For those who want to dive into the numbers:
✅ Organic reach for various post formats, stories, Reels, carousel, IGTV videos.
✅ Total reach from sponsored posts.
✅ Detailed breakdown between followers and non-followers.
✅ Retargeting: intersection of audiences reached by both sponsored and organic content.
NOTE: If you have a Not Just Analytics subscription, you will find the new charts already active in the “General Data” section of your profile and you can also include them in the reports you send to your clients!
Before diving into the juiciest information, here are a couple of details and curiosities about the data from the Instagram Reach Distribution feature of Not Just Analytics:
NOTE: We recommend analyzing this information over a time frame of 30 days for absolute accuracy. Beyond 30 days, Meta’s official permissions (API) require us to make an estimate.
Here’s a rundown of super useful information you can obtain from Not Just Analytics’ new Instagram Reach Distribution feature.
Let’s look at a simple method to find out! To calculate the economic value of your posts, you can use the CPM (Cost Per Mille) logic, usually used for impressions, but in this case applied to reach.
Here’s how: divide the total amount you’ve invested in advertising by the total reach obtained from sponsored posts and multiply the result by 1,000. For example, if you spent €250 and obtained 100,000 coverage, your CPM for coverage will be €2.50. This means that every 1,000 unique views cost you €2.50. Now, to understand the economic value of a post, divide your average reach by 1,000 and multiply the result by the CPM. This way, you’ll have a precise idea of the economic value of your posts.
Analyzing your stories’ reach is essential. Divide the reach of your stories by the total number of your followers to find the percentage of followers you’ve reached. If this percentage is low, you might:
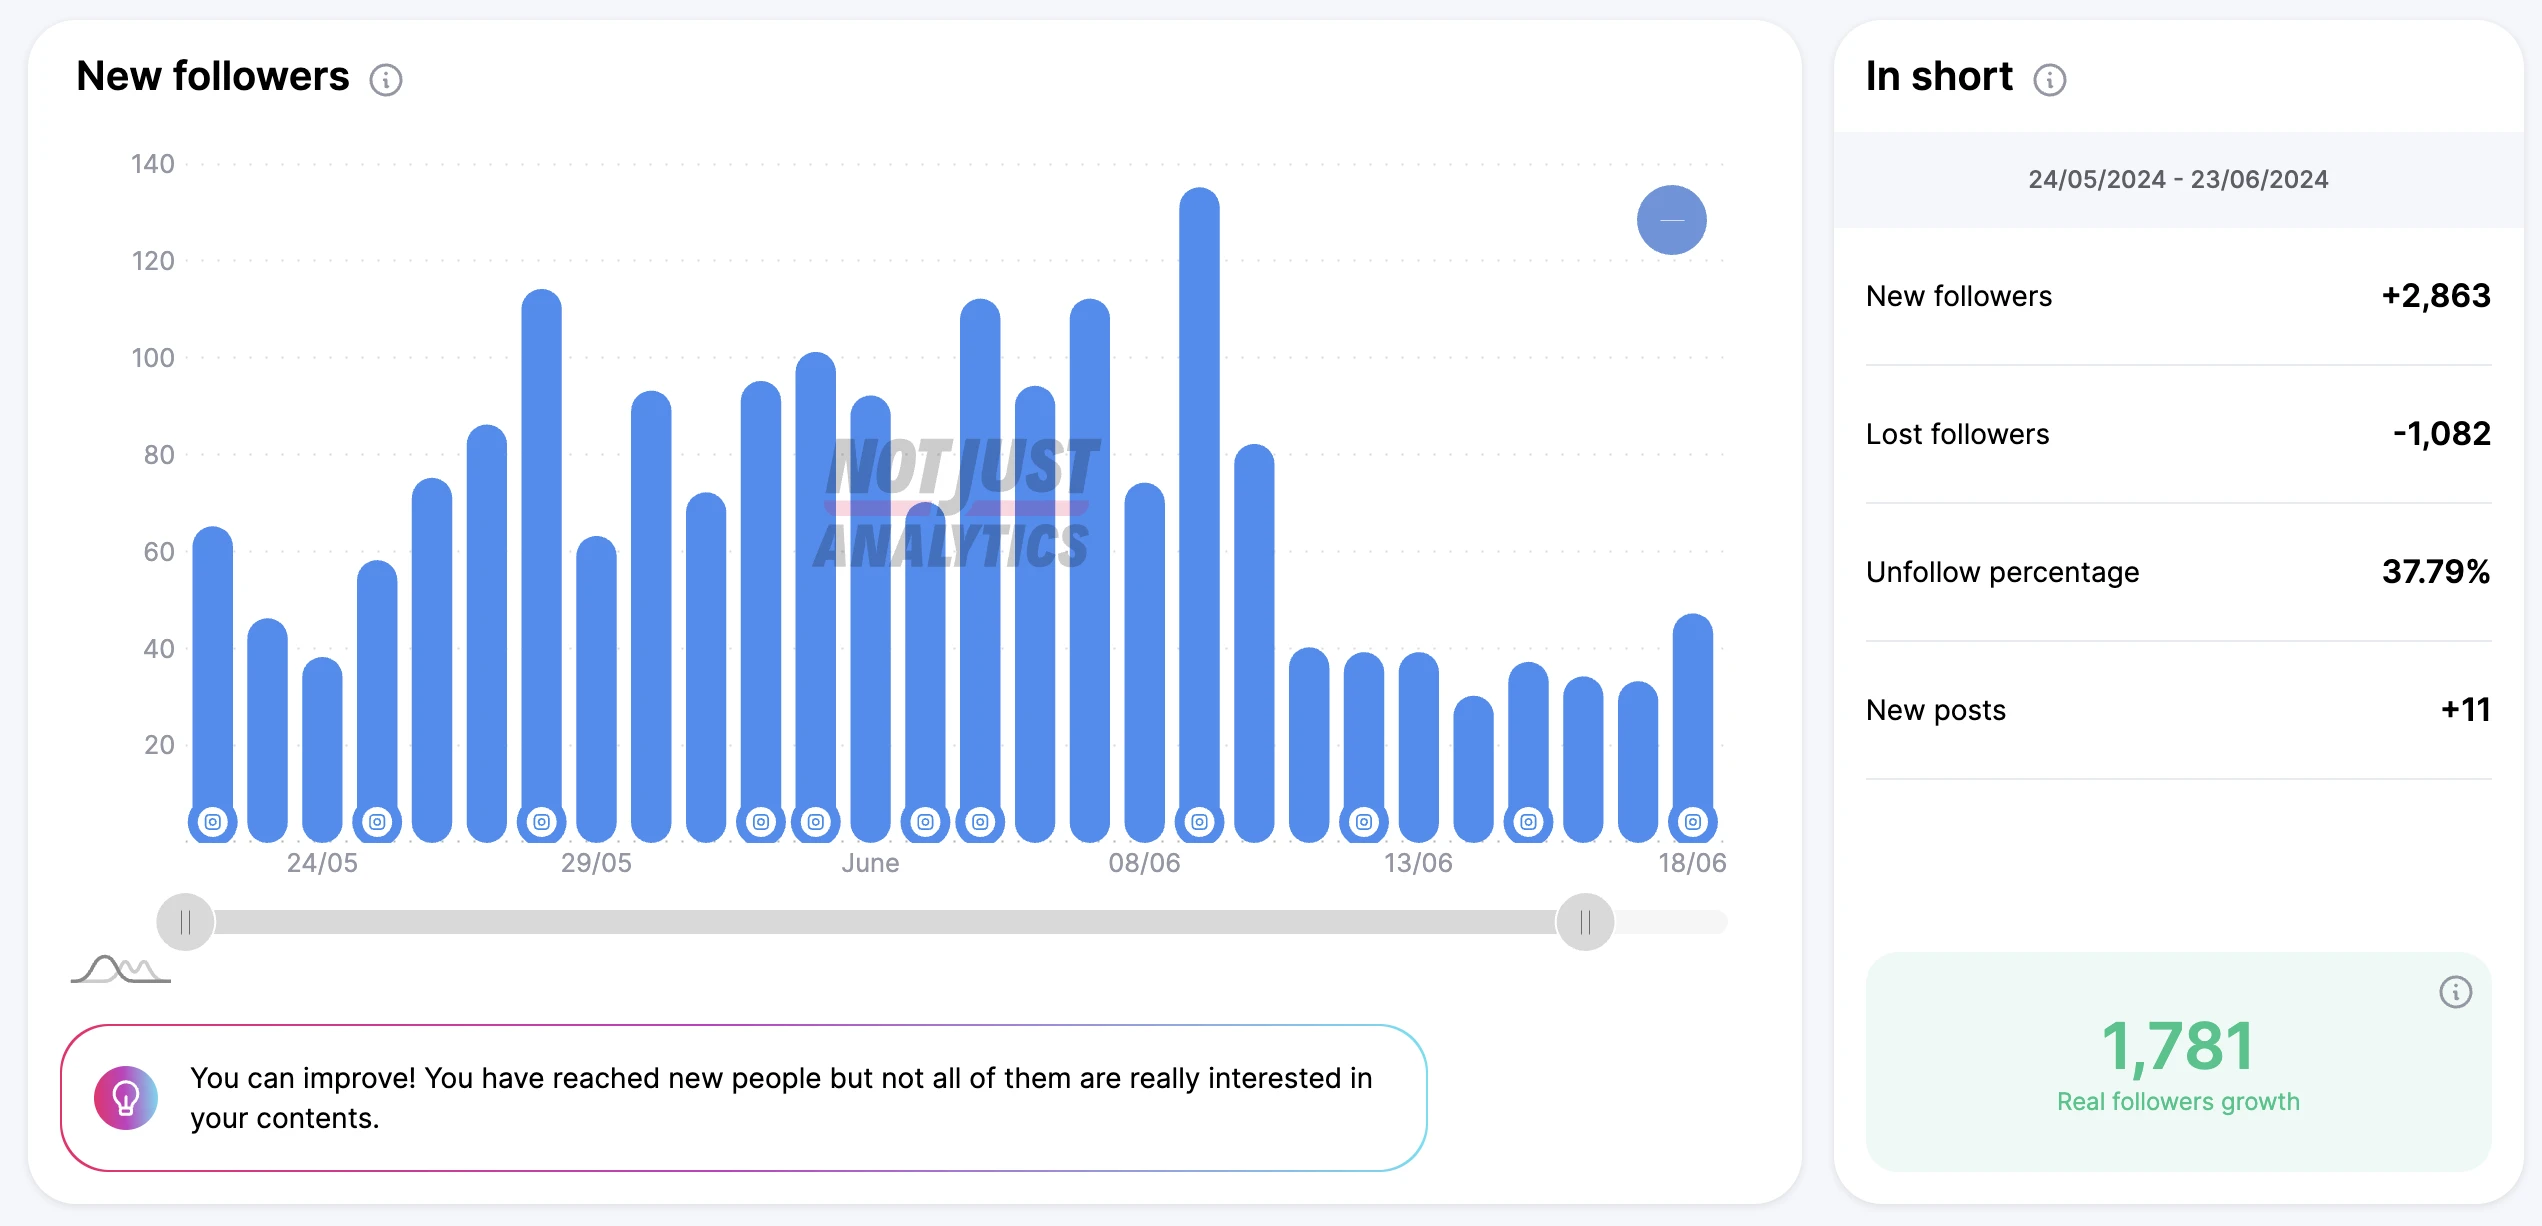
To better understand your profile’s potential, subtract the number of followers reached in the last 30 days from your total followers. The result is the number of people who follow you but do not see your content. If the number is high, it might be necessary to review your communication strategy or check if your profile is being penalized by Instagram. Speaking of strategies: read this article to learn how Instagram’s new algorithm shows your posts.
By playing with the numbers, we managed to get the exact number of people who saw your sponsored posts but already followed you on Instagram! Divide this number by the total sponsored reach to know how Instagram spent your budget between cold and warm audiences.
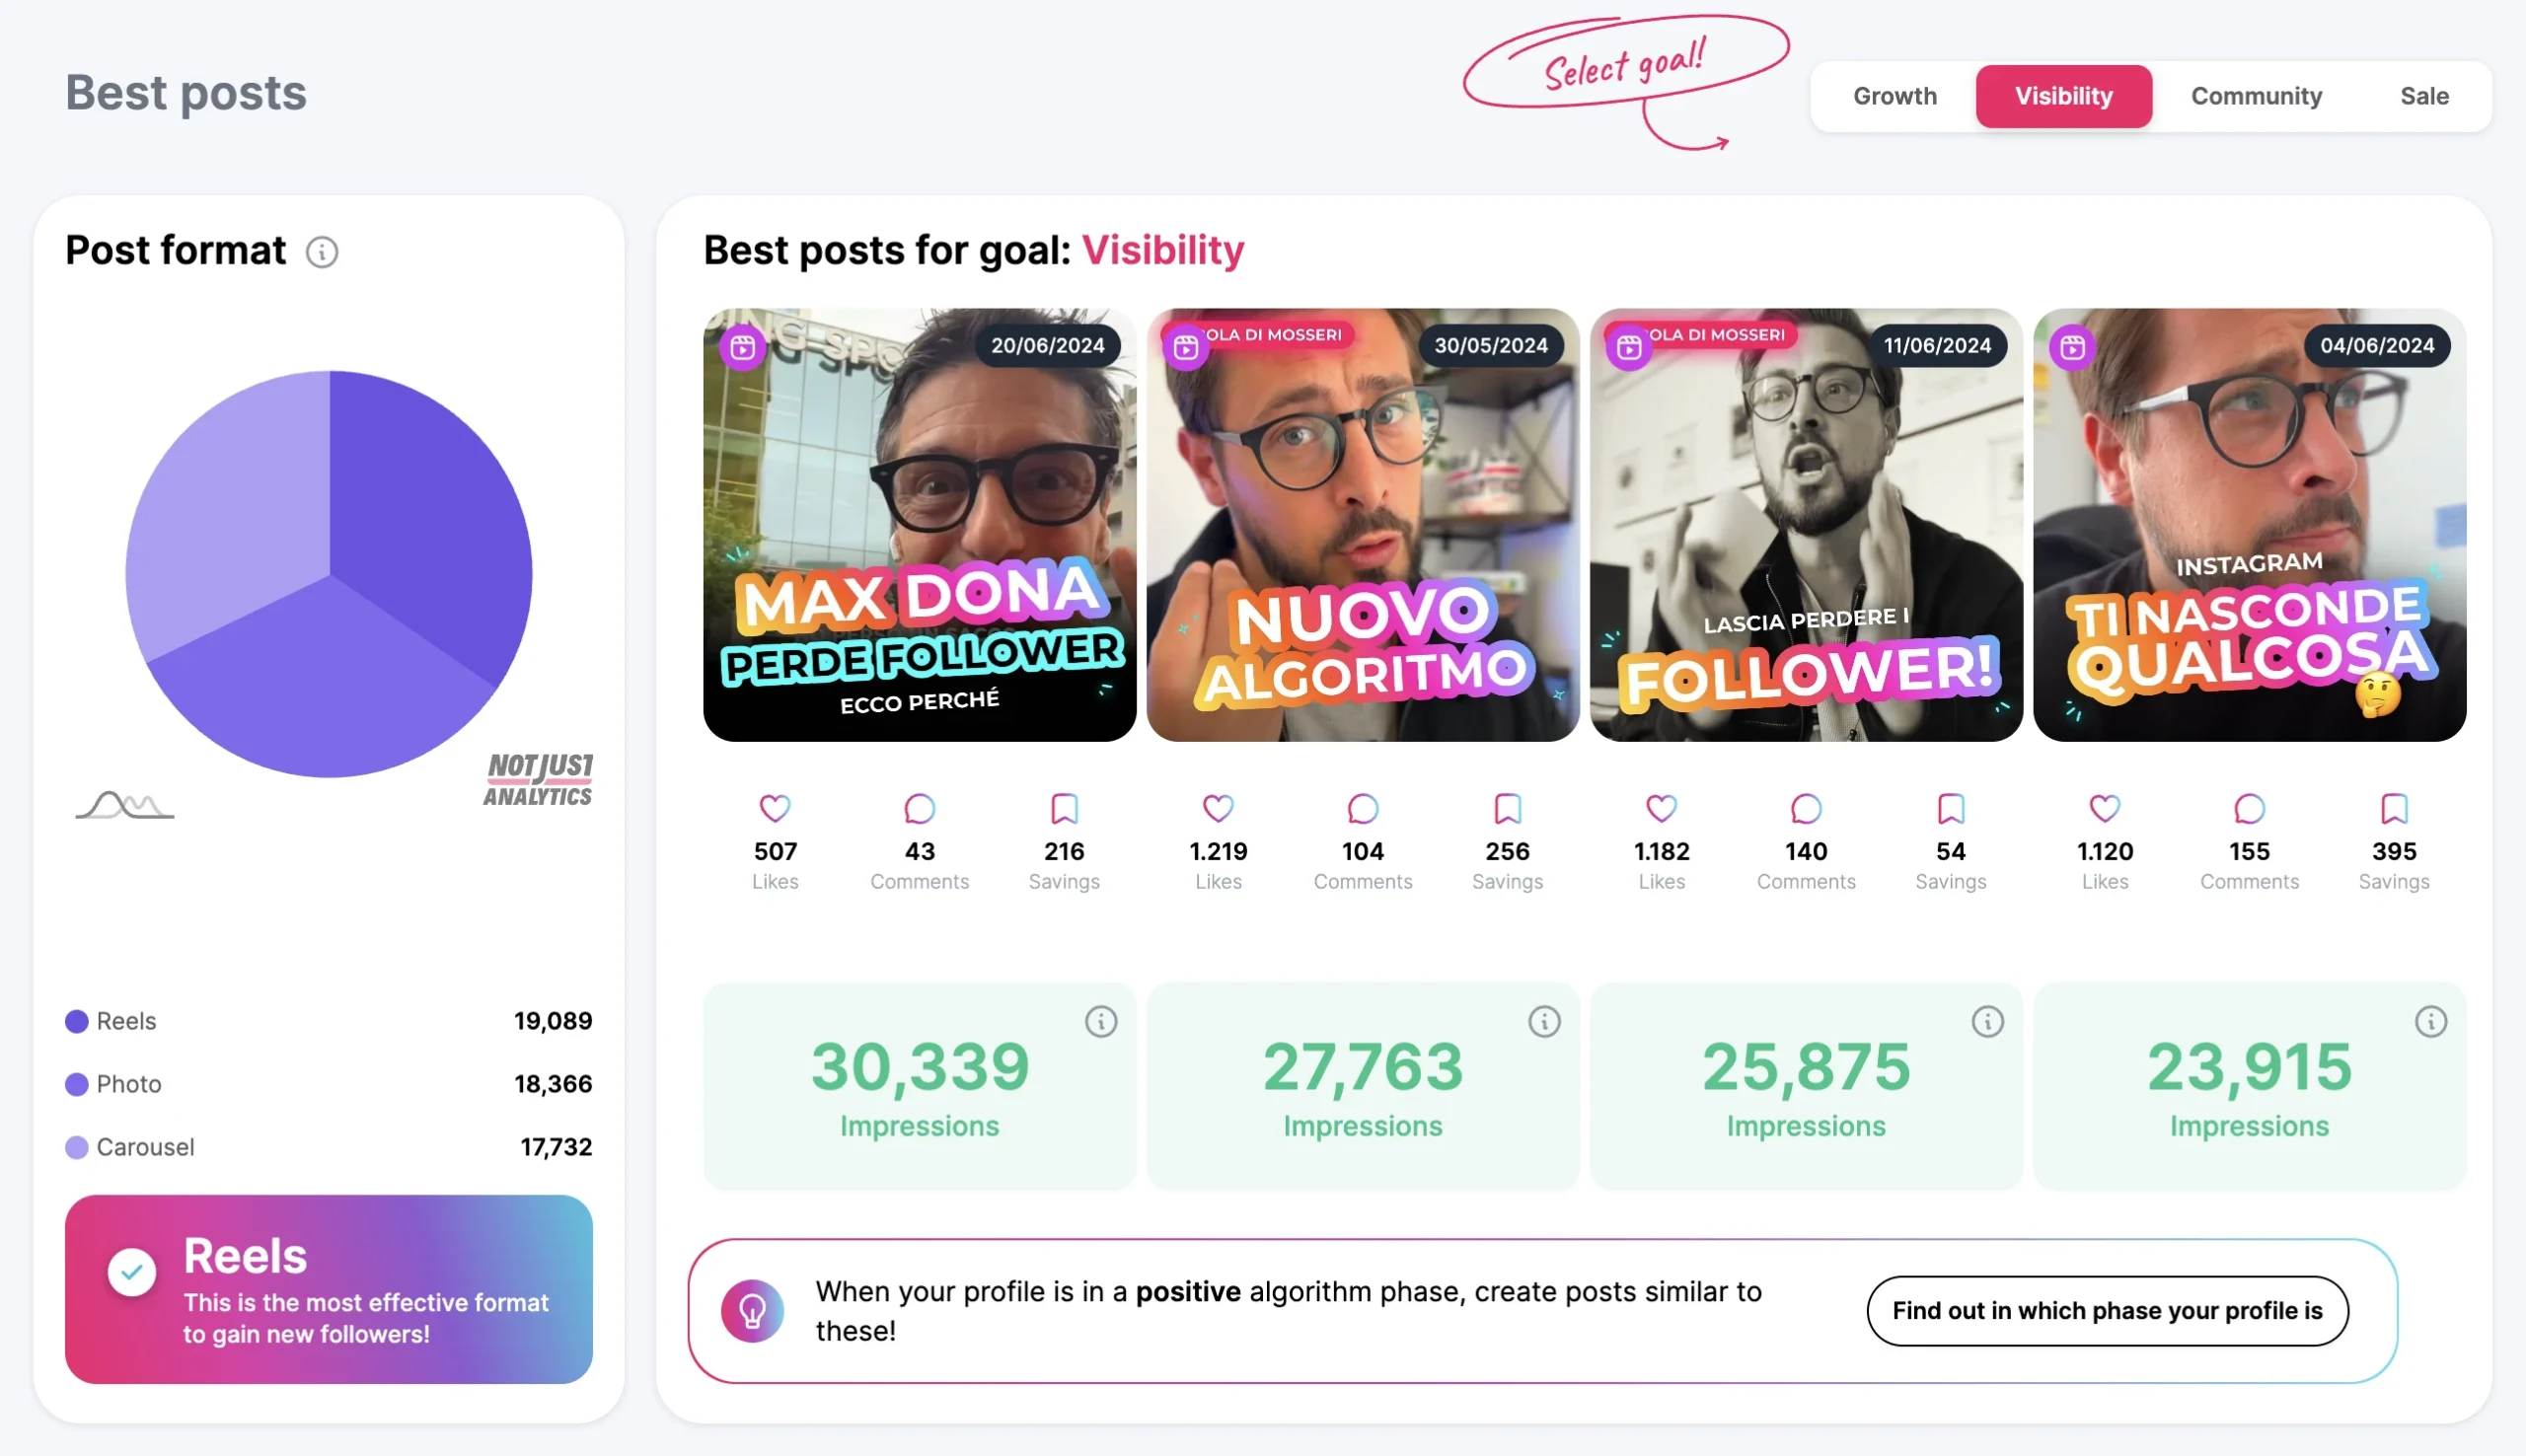
The data includes results from posts published in the past that continue to generate reach over time. Before jumping to conclusions, remember to check the “Best Posts” section in Not Just Analytics’ post analysis to see which format works best for each goal (Growth, Visibility, Community, Sales).
Even though this format no longer officially exists on the Instagram app, the algorithm sees things differently. Instagram still considers Reels longer than 3 minutes as IGTV, penalizing them in terms of reach. Therefore, avoid creating Reels that are too long to prevent reducing their visibility. On the other hand, this information can be useful to evaluate how much reach the Lives saved in your profile feed are generating.
The introduction of Instagram Reach Distribution allows us to provide a set of highly requested data from our users. Once again, the significant difference, and NJL’s strength, isn’t just “having the data” but what useful information you can extract to make informed decisions and plan medium- to long-term strategies.
This section is just the first of a series of new features we’re releasing, thanks to an update of Meta’s Official APIs. Our goal is to continue providing advanced tools that help our users better understand Instagram dynamics and optimize their work!
Want to try this feature but don’t have a subscription? Click here to choose the subscription that suits you best, and remember, this feature is included in all subscriptions!